Accessing Analytics #
PCRecruiter Analytics is an add-on feature that requires configuration by your designated Analytics Power User, often with the assistance of a PCRecruiter consultant.
Once your Analytics are properly configured, they become easily accessible. To access Analytics, simply select “Analytics” from the main menu. Once you enter the Analytics interface, you’ll discover a variety of features and display options available to you.
Navigating Key Metrics #
This section allows you to assess your performance relative to your goals. When you click on a specific Key Metrics page, you can utilize the Filter option at the top to refine your data based on the following criteria:
- Database name
- Users (subject to analytics security permissions)
- Teams (subject to analytics security and your team memberships)
- Company name
- Position title
- Position status
- Record type

In addition, you’ll notice a three-lined icon at the top right, offering options to Refresh and Print your data.

Each of your Key Metrics may contain up to eight KPIs and four charts. Key Metrics will be configured to analyze KPIs based on a Weekly, Monthly, Quarterly, or Yearly basis and uses color coding to show if a user is on or off pace to meet their goal. Red dictates that the users are off pace, while green dictates they are on pace to meet their goal.
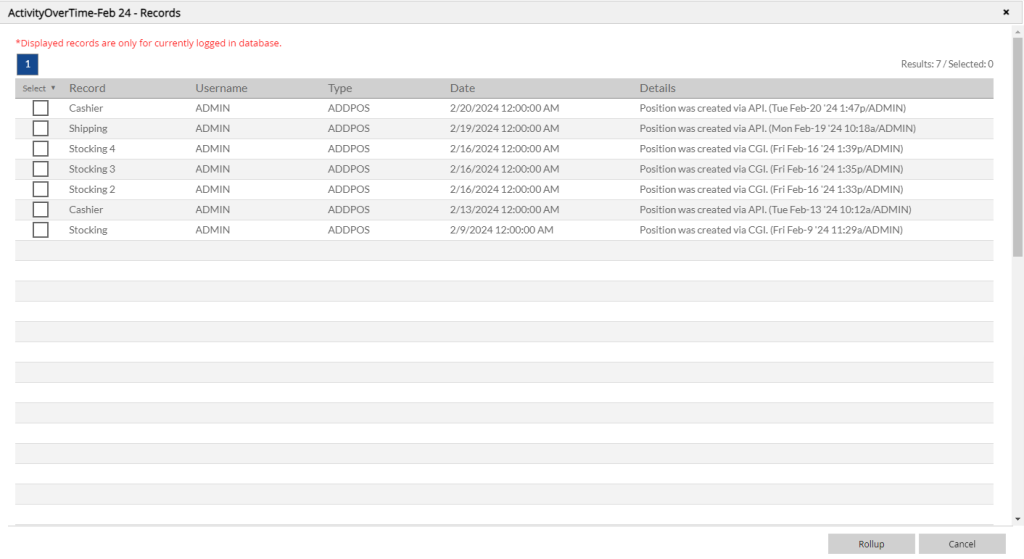
Clicking on any of your Key Metrics charts will display a list of the records that comprise that chart. (Note that this detail panel can only display records from the database you are currently logged into.)

Navigating Metrics #
Here, you can examine different Data Sets, each containing groups of data points. Within each Data Set, you’ll notice a Calendar icon at the top right, allowing you to specify the timeframe. Options include “This” and “Last” for Month, Quarter, Year, and Week. You can also select a Custom Range to define a specific date range. After adjusting the timeframe, the Metrics will automatically update with data for the selected period.
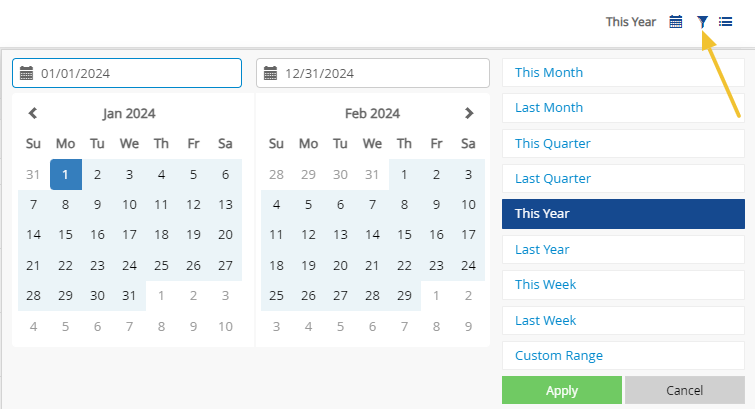
Furthermore, the Filter icon lets you choose from the following filters:
- Database
- User(s)
- Team
- Company Name
- Position Title
- Position Status
- Record Type

Just like in the Key Metrics section, the three-lined icon at the top right provides options for Refreshing and Printing your data.

Once you’ve applied your chosen filters, you can change the view of your metrics by Time, Client (Company), Employee, Job, or Team. Your data can be presented in both list and chart formats, and you can easily rearrange them to suit your preference by dragging and repositioning. In the List view, there’s also an option to export the data, which can be found at the top right of the table, enabling you to generate the data as a .csv file.
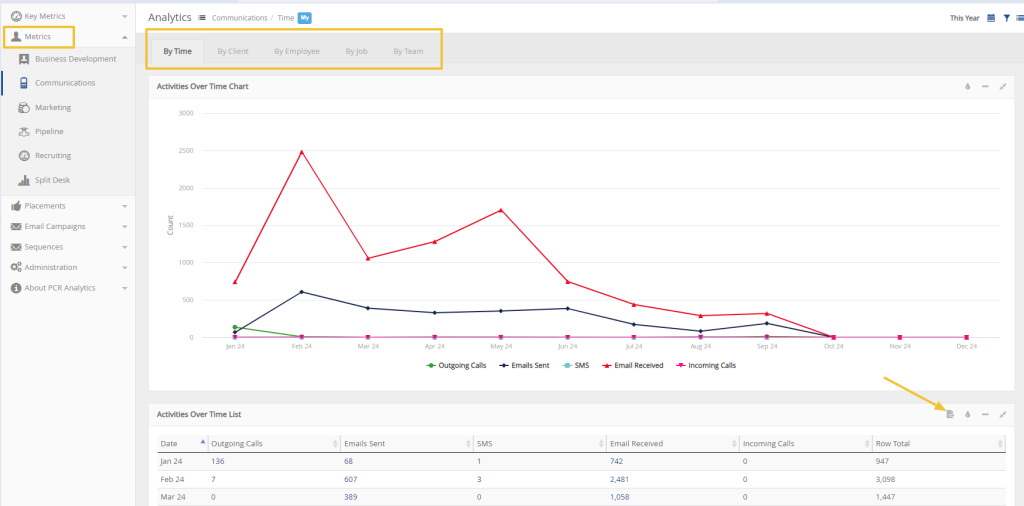
Should you wish to delve deeper into the numbers, clicking on a specific figure will grant you access to the activities or Pipeline steps associated with that metric. Please bear in mind that if you have multiple databases connected to Analytics, it will display details only from the database you are currently logged into.
Navigating Placements #
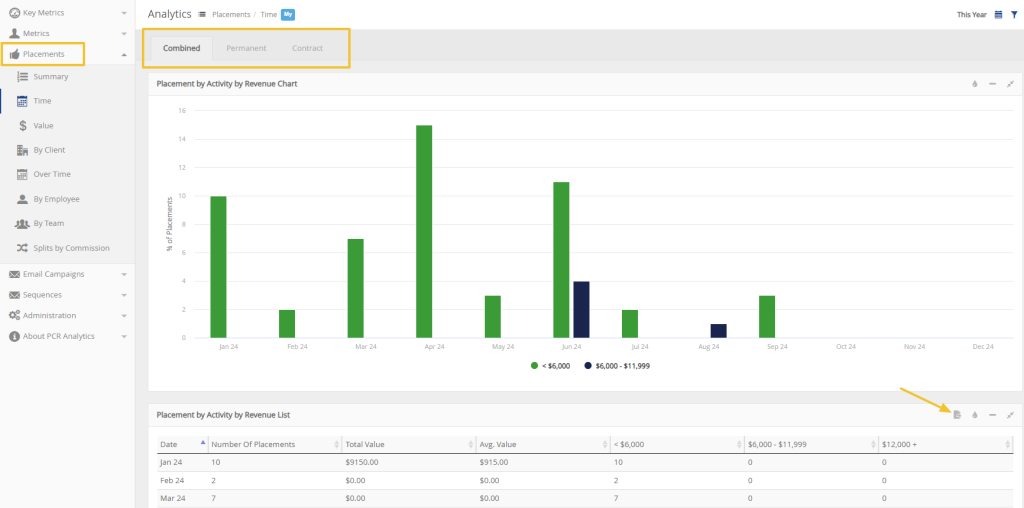
The Placements area provides an array of tools for analyzing the Placement data within your database. Within this section, you have the flexibility to explore your Placements using various criteria such as Summary, Time, Value, Client, Over Time, Employee, Team, or Splits. Additionally, you’ll encounter the same filter options for Key Metrics and Metrics, which include Database, User, Team, Company Name, Position Title, and Position Status.
Placements can be combined or separated into permanent and contract categories. You can choose to display your data in either list or chart formats and effortlessly rearrange them to your liking by simply dragging and repositioning elements. In the List view, there’s also an export option located at the top right of the table, allowing you to generate the data as a .csv file.
Email Campaign Analytics #
The Email Campaigns section allows you to assess the statistical outcomes of your email campaigns. Click to learn more about this feature. The statistics in this section also include any Automatic or Manual email data related to your Sequences.
Campaign Summary #
Under the “Summary” tab, you can examine campaign names categorized by user or team within a specific time frame, facilitating comparisons between different campaigns.
Campaign Details #
In the “Details” section, you’ll discover comprehensive results of each campaign, including data on the number of recipients, email opens, clicks, replies, bounces, and unsubscribes.
Sequence Analytics #
Sequencing Analytics allows the user to determine the previous activity and outcomes from your Sequences. This data can then be used to determine the next steps for a future Sequence or to track the success of a previous one. You can access this feature both from the Sequences section or within the Analytics interface.
Comparable Metrics #
Comparable Metrics offers comprehensive insights into your sequences. This feature allows you to access specific step types and their outcomes. Here you can also use those metrics to see the specific names that have met that outcome or completed that step. You can delve deeper to identify who completed each step and when for assitance in Analyzing past Sequences or to construct future ones.
Sequence Results #
Sequence Results provide a comprehensive view of your sequences and their performance. A visual flow diagram displays the sequence’s steps, and by clicking on individual steps, you can access detailed information, such as email reply rates. This allows you to determine the success of your Sequence and can give you insight in to the best ways to improve your workflow for future Sequences. Additionally, you can review results based on specified conditions, allowing for a deeper understanding of your sequence’s impact and effectiveness.
Administration #
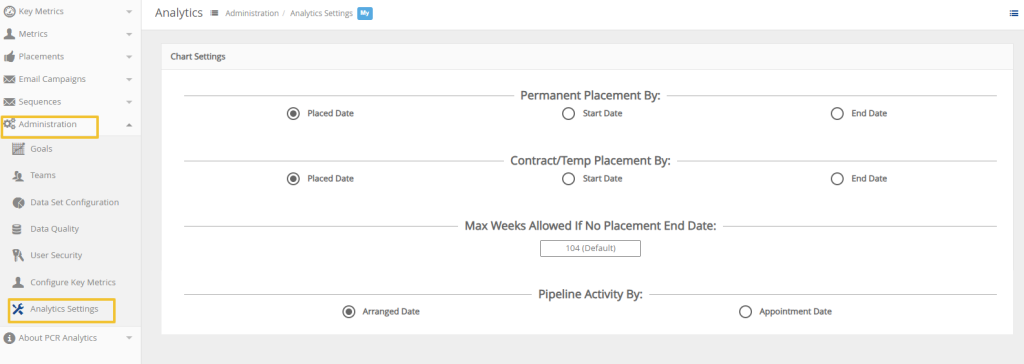
This option is exclusively available to Analytics Full Admins. Here, Analytics Full Admins can configure user filter security, create teams, and define data sets, goals, and key metrics. Analytics Settings can also be adjusted.
About PCR Analytics #
In this section, under Data Refresh Log, you will discover details about the connected databases and when data was pulled from them. Data from the connected databases is refreshed approximately every 15 minutes.

