This feature provides a comprehensive view of sales performance and deal activity across different dimensions. It includes tools to track revenue trends, analyze sales funnels, and evaluate performance. Users can monitor metrics such as total deals won, win rates, deal values, and time-based revenue changes using visual reports like funnels, bar charts, and bubble charts. These sections help identify sales patterns, measure productivity, and optimize deal management strategies.
This information can be filtered based on:
- Week, Monthly, and Yearly time scales.
- Record Owner: Username the Deal is assigned to.
- Industry Type: Value in Industry field on the Company record.
- Deal Source: Value in Source field on the Deal record.
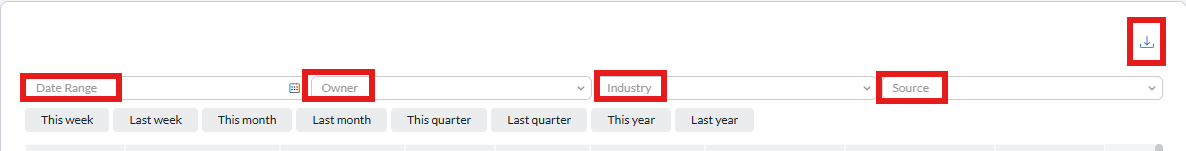
These charts can also be exported as .csv .png or .jpg file types. This can be done by clicking the export icon in the top righthand corner of the analytics screen or from an individual chart. Exported chart example can be found below. Please note that all filters applied to the chart at the time of the export will be reflected.
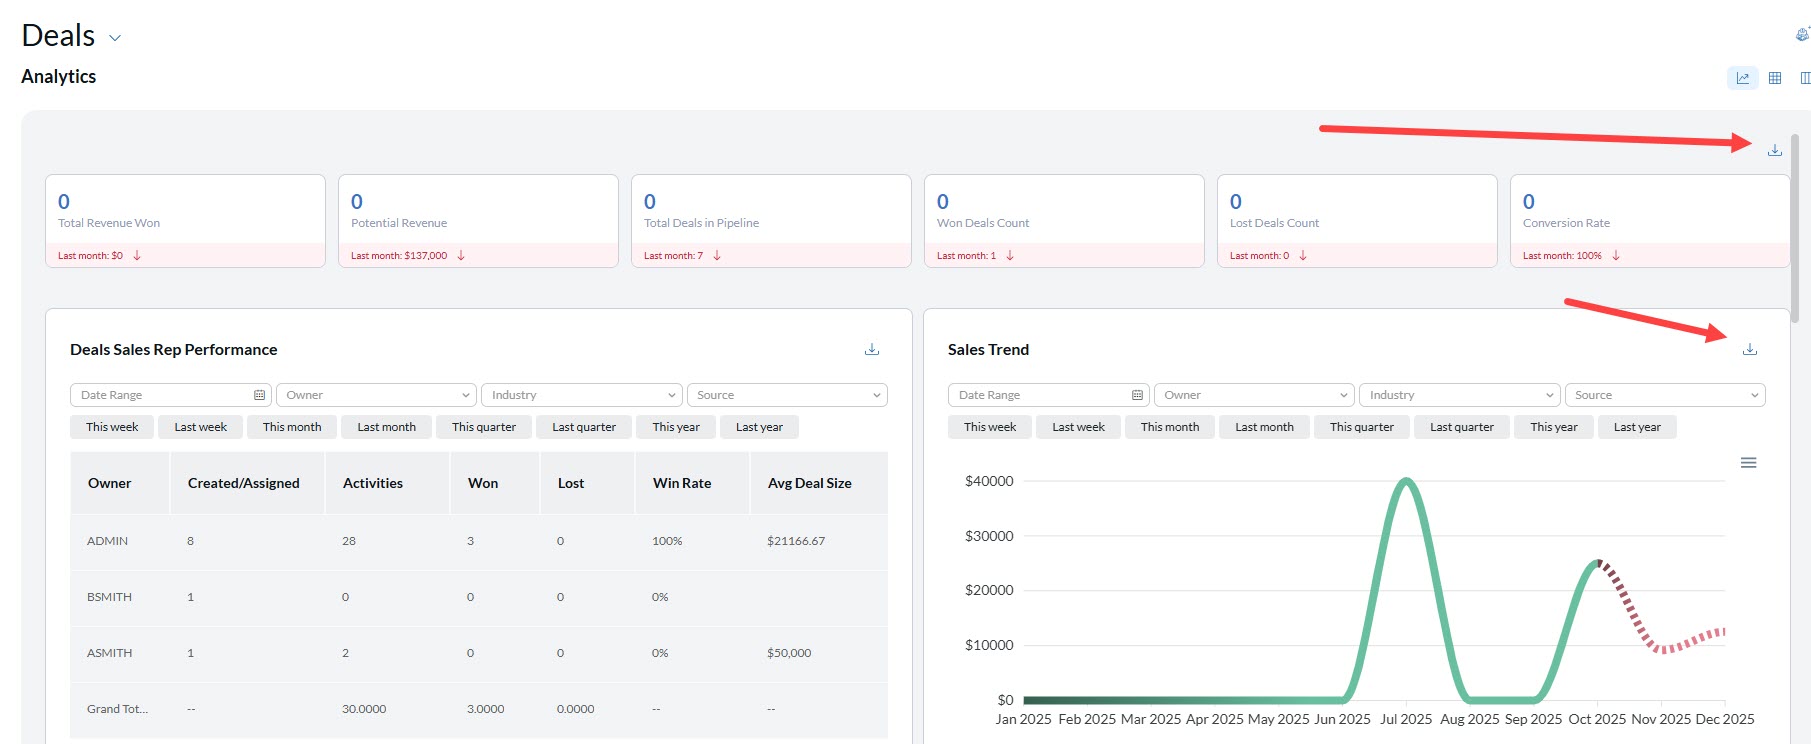
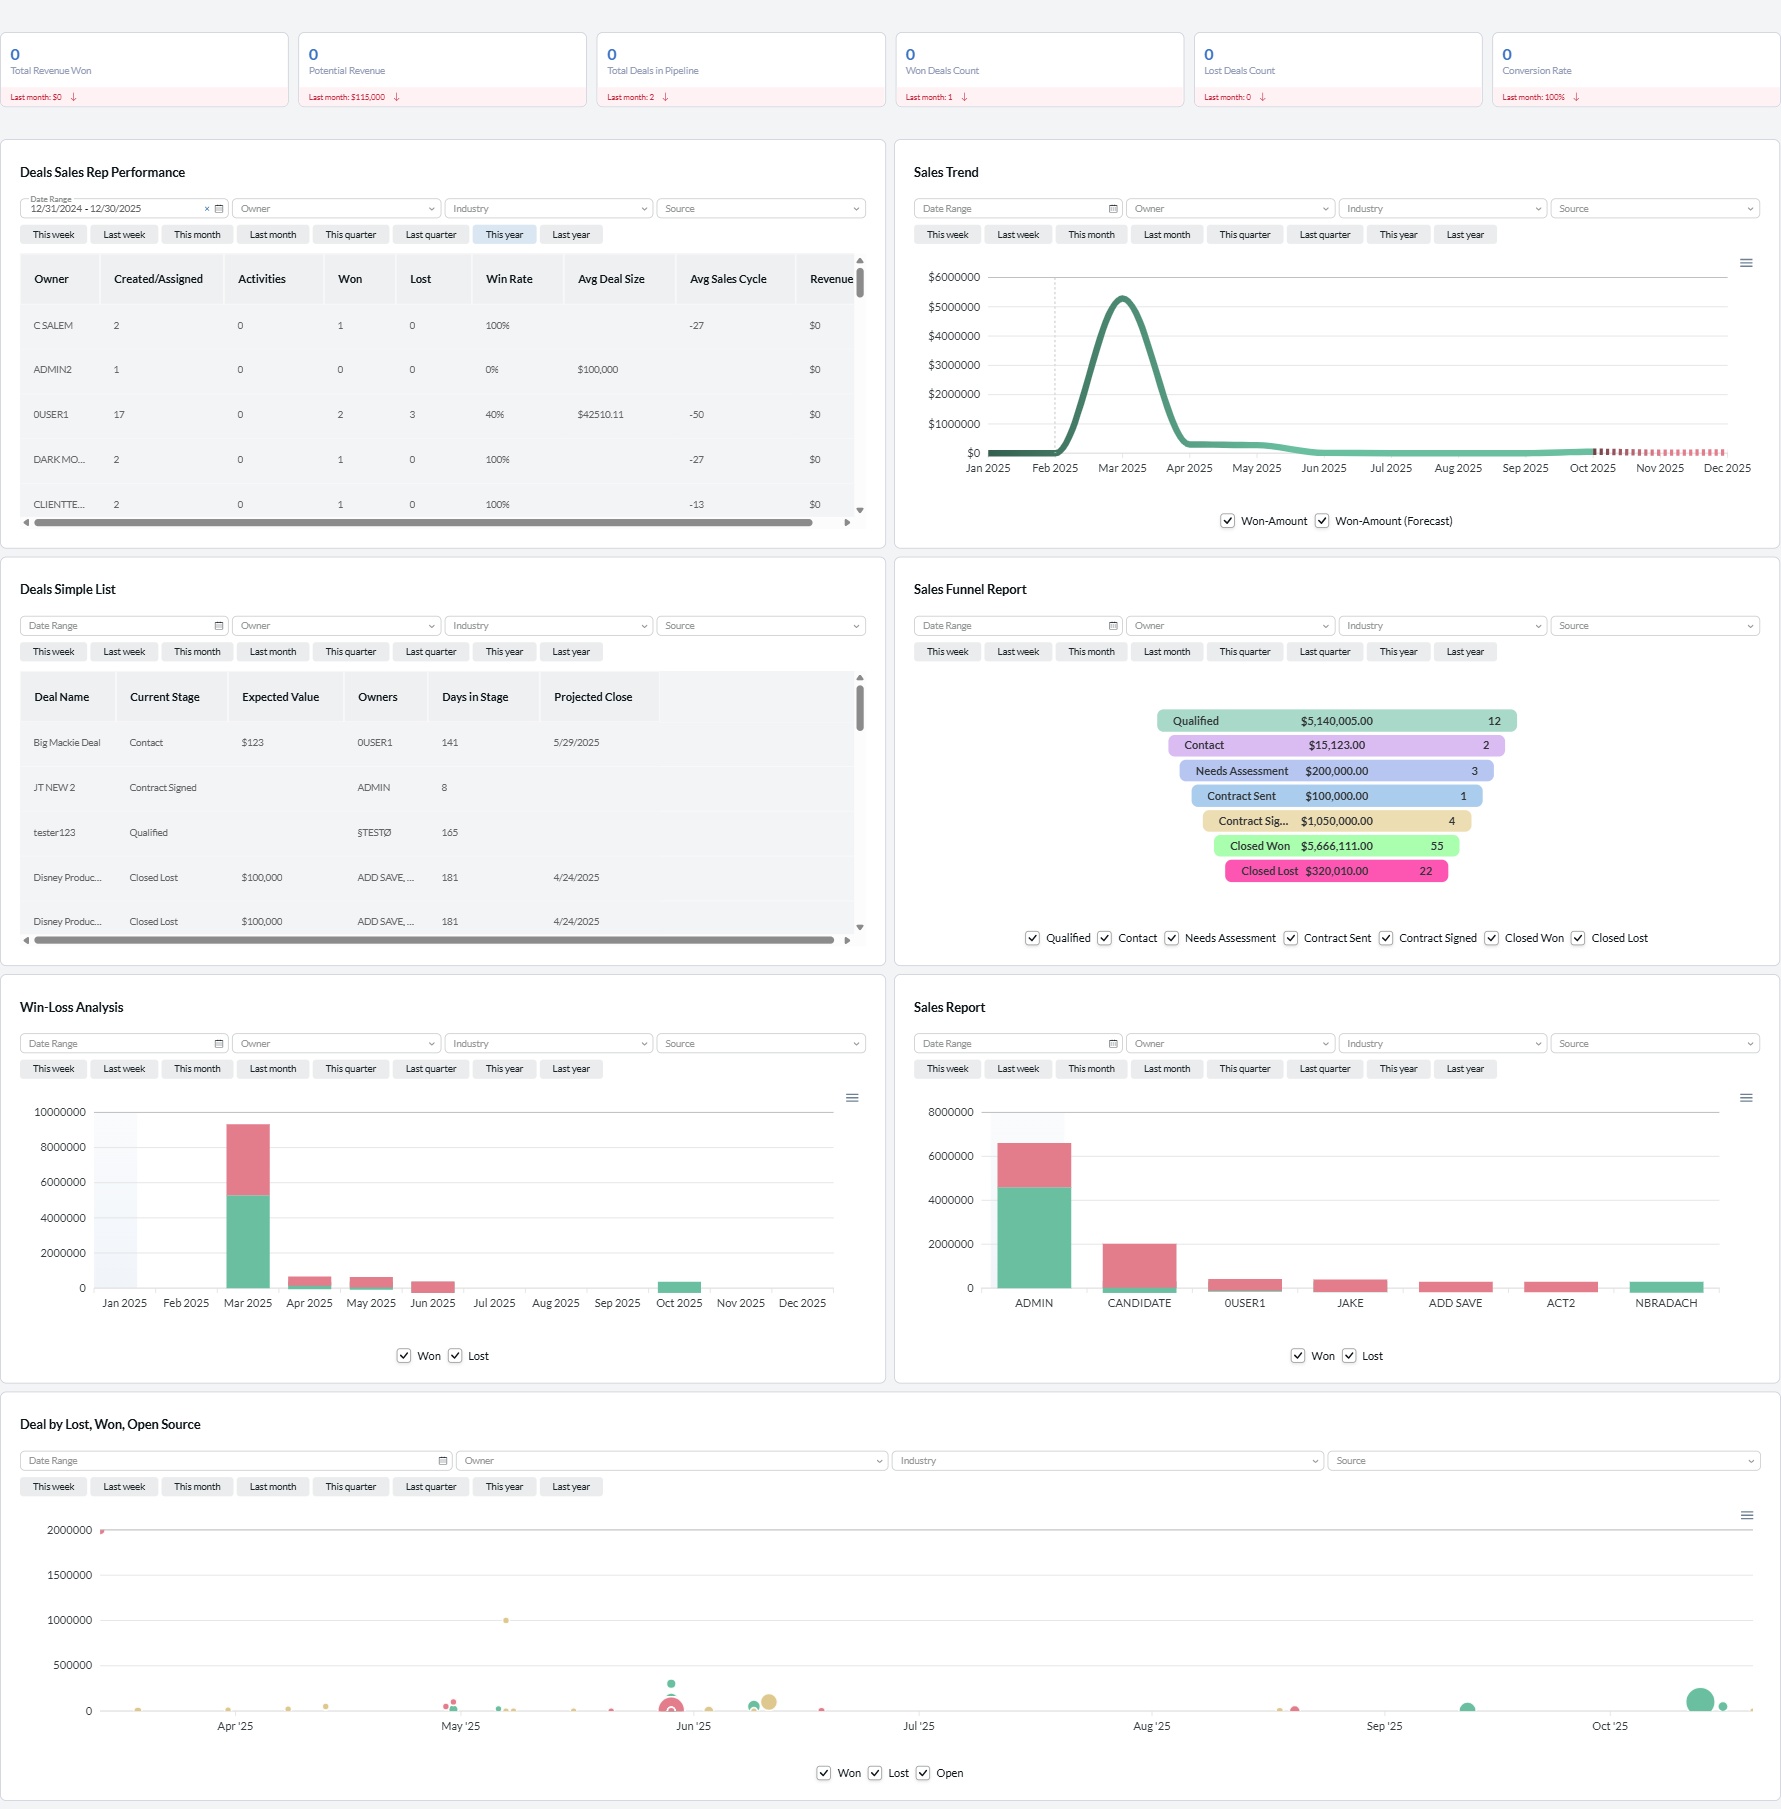
Deals Sales Rep Performance #
This section provides information on the overall performance of each User based on different metrics such as total Deals Won, Win Rate, and Revenue.
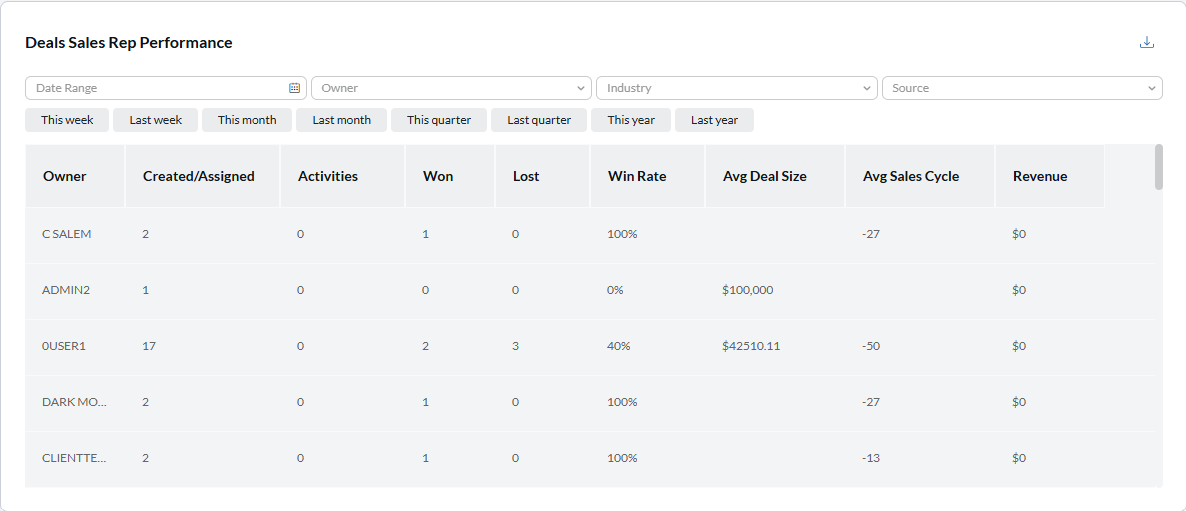
- Owner: Username with assigned Deal records.
- Created/Assigned: Total number of Deals created by or assigned to the user.
- Activities: Total number of Deal activities for the user.
- Won: Total number of Deals marked as Closed Won for the user.
- Lost: Total number of Deals marked as Closed Lost for the user.
- Win Rate: Percentage of Deals Won compared to total Deals closed (Won and Lost) for the user.
- Average Deal Size: Average revenue value across all Deal records assigned to the user.
- Average Sales Cycle: Average duration from Deal creation to reaching Closed Won or Closed Lost status.
- Revenue: Total revenue earned from Deals Won for the user.
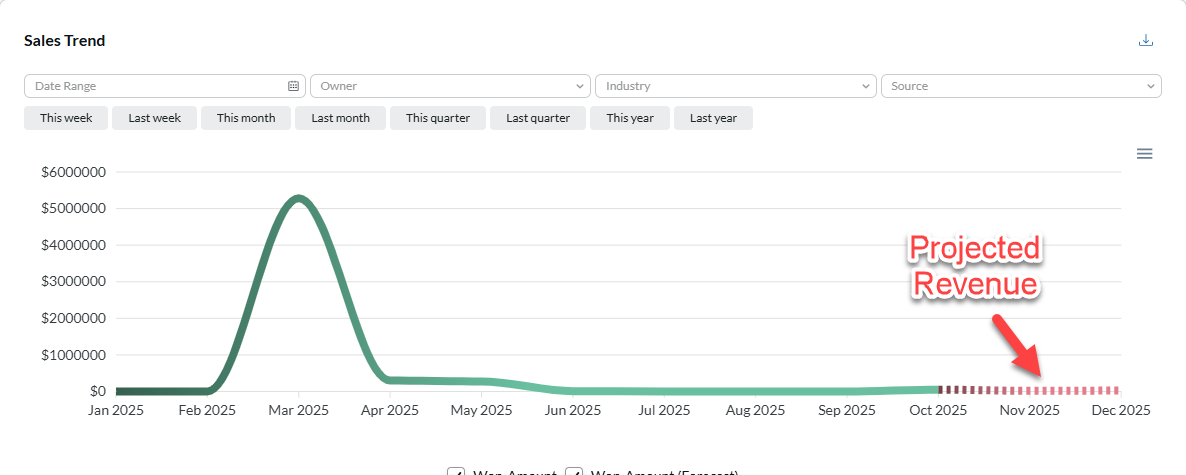
Sales Trend #
This section provides information on total revenue gained with a variety of time based filtering available.
This tool will also predict a Projected Revenue based on previous Revenue generated
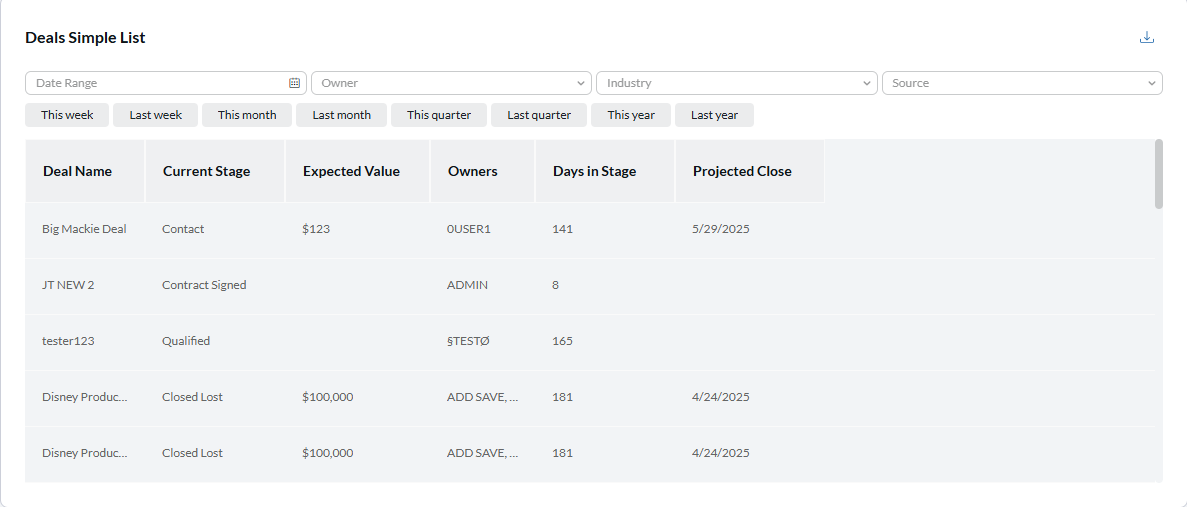
Deals Simple List #
This section will display any over-all list of current deals with information regarding their current status, potential value, user, and total days since the deal was created
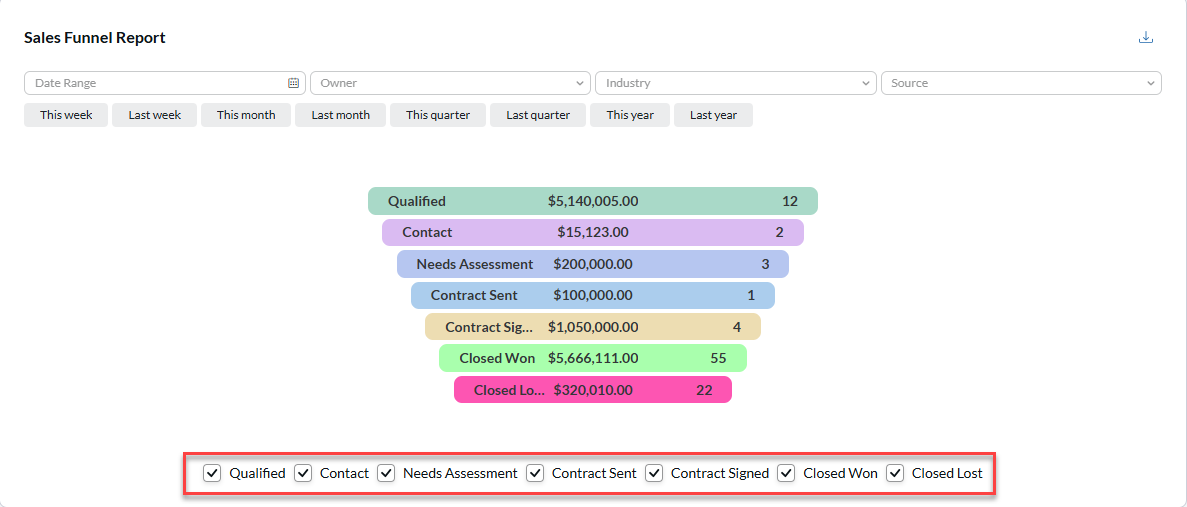
Sales Funnel Report #
This section shows a funnel of deals and totals of deals in each stage. This section can be additionally filtered by adding or removing the Deal stage at the bottom of the chart
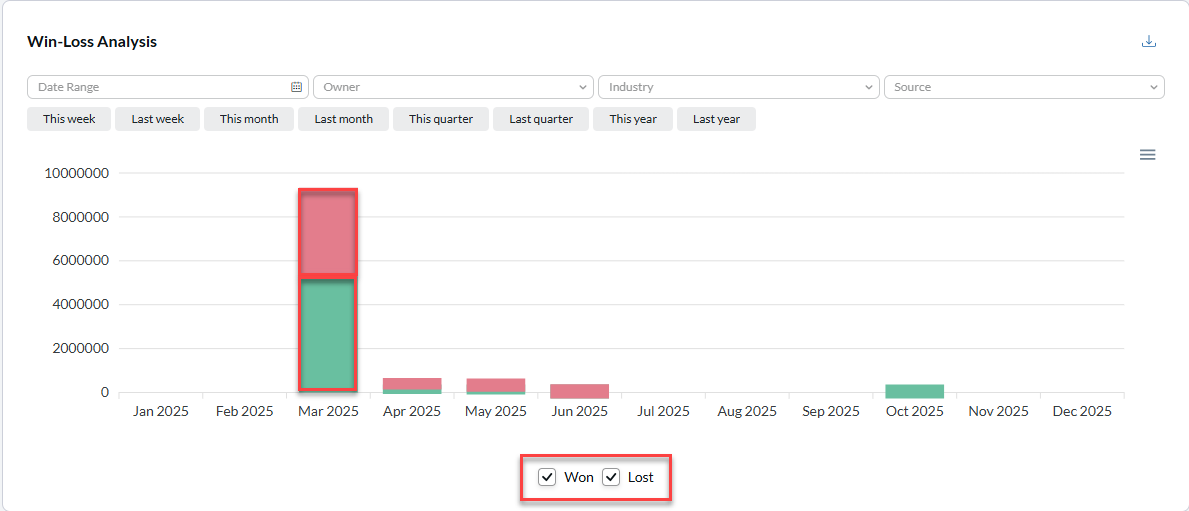
Win-Loss Analysis #
This section shows a bar graph of the deals that have been won (green) against the deals that have been lost (red). This provides clear visibility on these ratios in a monthly breakdown.
This chart can also be filtered by Win/Loss using the checkboxes at the bottom of the chart.
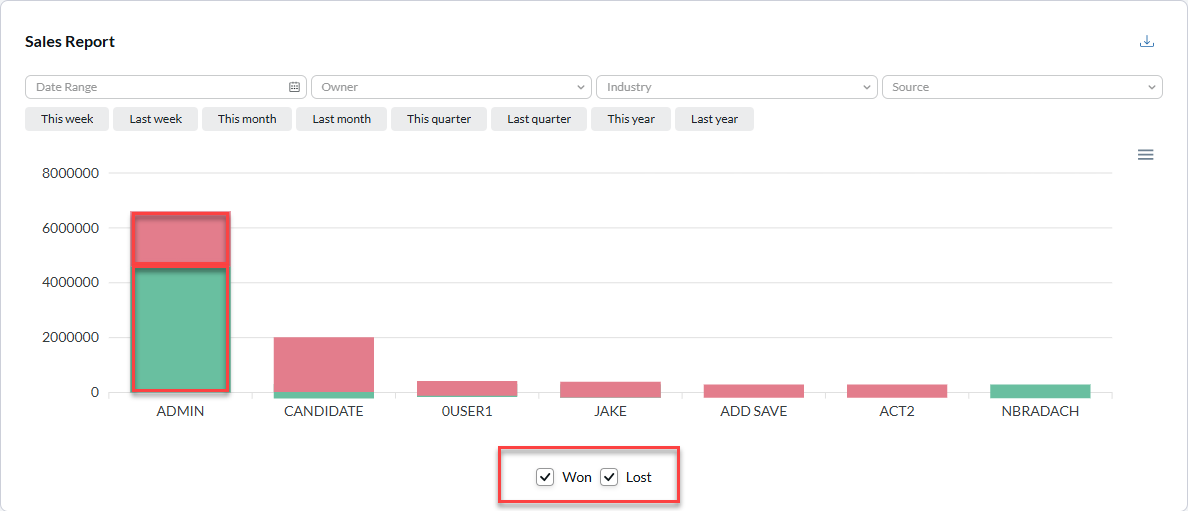
Sales Report #
This section shows a bar graph of the deals that have been won (green) against the deals that have been lost (red). This provides a clear analysis on performance based on Users.
This information can also be filtered by Win/Loss using the checkboxes at the bottom of the chart.
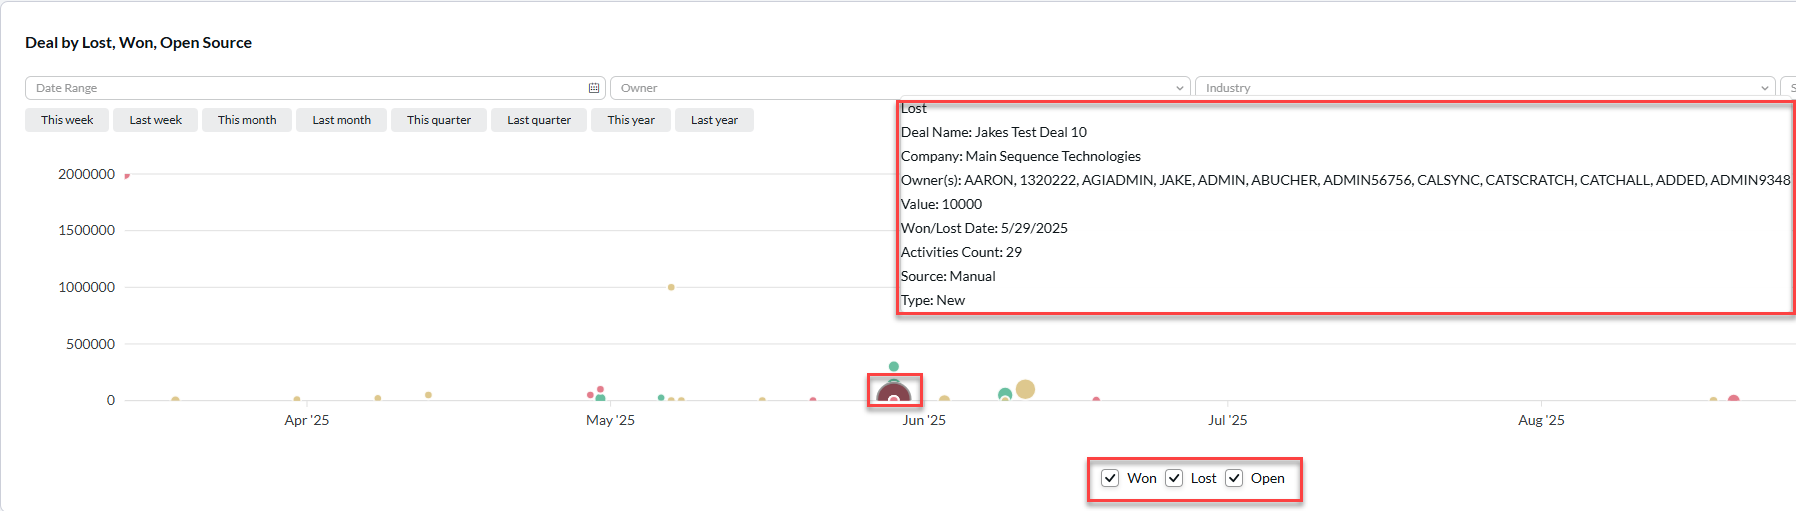
Deal by Lost, Won, Open Source #
This section shows a bubble chart to depict the size and effort that was put into a deal. This is broken into a few variables:
- Size: The size of the bubble will depict the number of Activities to demonstrate the amount of effort put into this deal
- Color: The color of the deal with depict the current status of the deal
- Won: Green
- Lost: Red
- Open: Yellow
- Height: The height on the chart will depict the value of the deal shown to the left which has the specific value
Hovering over the bubbles will provide further clarifying information on the Deal.